Beyond Carbon: The Definitive Guide to Nature Footprint and Handprint

For the past decade, corporate sustainability has been dominated by a single metric: carbon. We obsess over greenhouse gas (GHG) emissions, aiming for "Net Zero" and "Carbon Neutrality." But an undeniable truth is emerging across global sustainability frameworks: solving the climate crisis without addressing the biodiversity crisis is impossible.
We are now witnessing a paradigm shift from **Carbon Neutrality** to **Nature Positivity**. Central to this shift are two critical concepts: the **Nature Footprint** and the **Nature Handprint**.
1. What Are the Nature Footprint and Handprint?
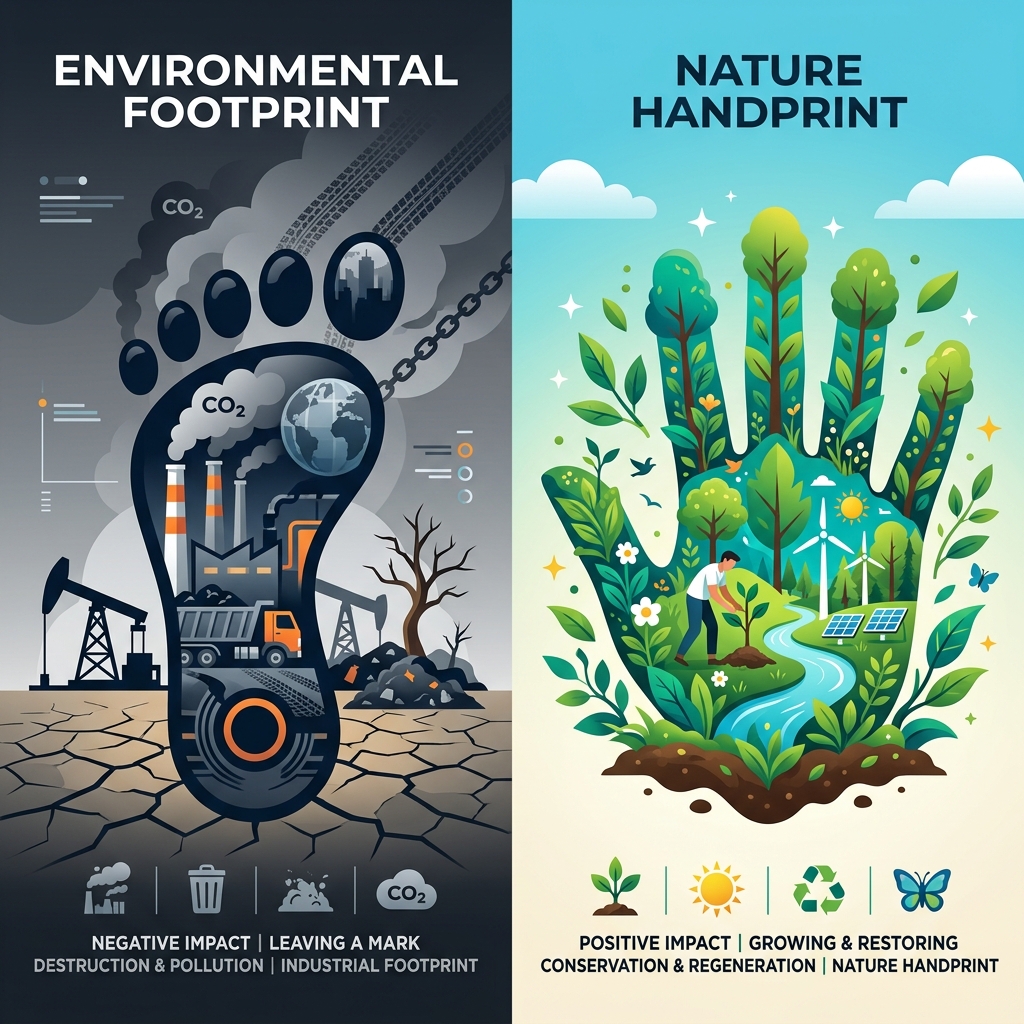
The Nature (Biodiversity) Footprint: Measuring the Damage
The Nature Footprint quantifies the total negative impact—or the "damage"—an organization, product, or service exerts on the natural world and biodiversity. Just as a carbon footprint measures emissions that drive global warming, the nature footprint measures activities that drive species loss and ecosystem degradation. This includes impacts from:
- Land use change (e.g., deforestation for agriculture)
- Resource extraction (e.g., mining, overfishing)
- Pollution (e.g., nitrogen/phosphorus runoff into water systems)
The Nature (Biodiversity) Handprint: Measuring the Good
The "Handprint" is a conceptual framework pioneered by the VTT Technical Research Centre of Finland and LUT University. While a footprint is something you want to shrink, a handprint is something you want to grow.
The Nature Handprint measures the positive, restorative impacts an organization creates that would not have occurred without their intervention. It is the quantifiable benefit provided to nature, such as:
- Restoring degraded wetlands or forests.
- Removing pollutants from local waterways.
- Creating structural solutions that actively support local biodiversity in urban planning.
The Goal
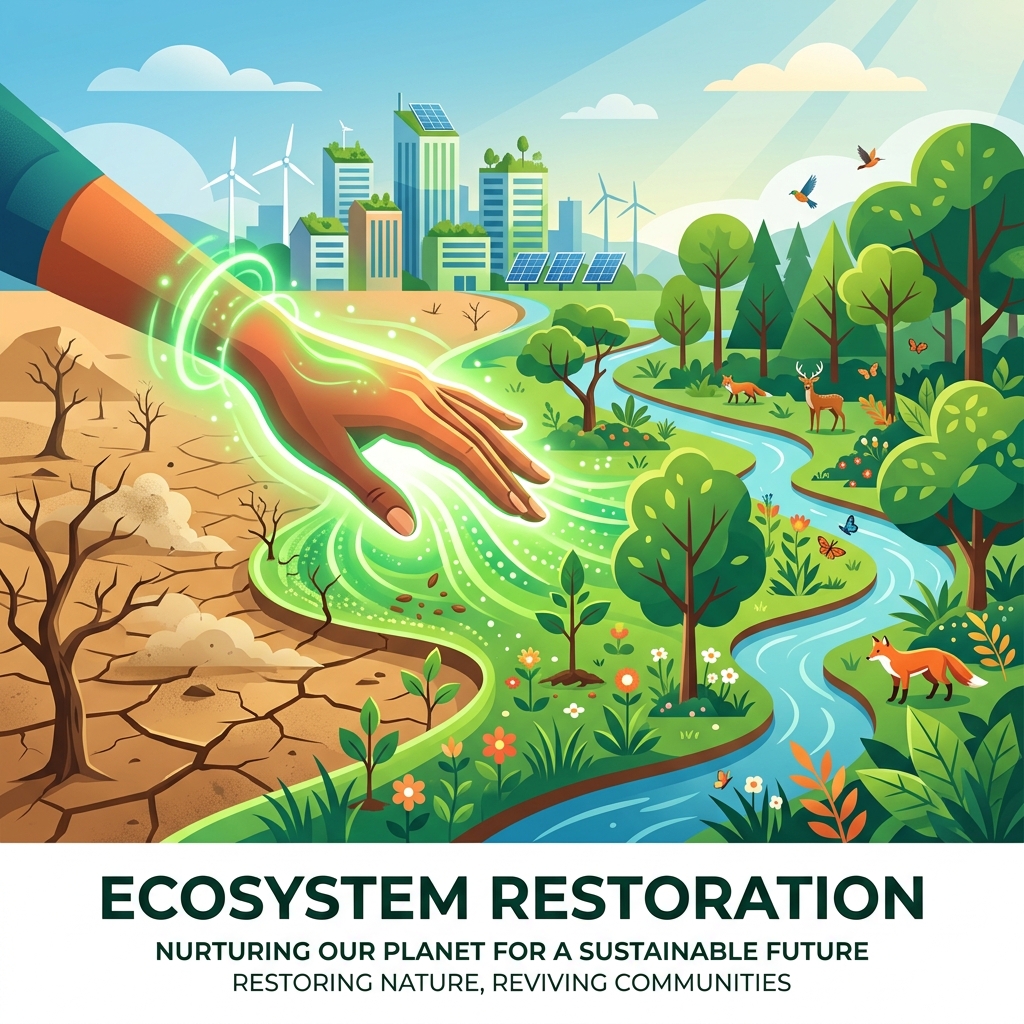
The ultimate objective for a sustainable organization is not just to reduce its footprint to zero, but to grow its handprint so large that it achieves a Net Positive impact on nature.
2. How Do We Calculate Them?
Unlike carbon (tCO₂e), which mixes well globally and has the same climate impact regardless of where it is emitted, biodiversity impact is highly localized and context-dependent. Cutting down a hectare of the Amazon rainforest has a vastly different ecological cost than clearing a hectare of commercial pine forest in Scandinavia.
The BIOVALENT Methodology
To solve this, researchers—notably the JYU.Wisdom team at the University of Jyväskylä in Finland—have developed open-source methodologies like the BIOVALENT database.
BIOVALENT uses a spend-based approach (similar to Scope 3 GHG calculations):
- Financial Input: An organization inputs its procurement volume or General Ledger (GL) spend data.
- Economic Mapping: The data runs through EXIOBASE, a highly detailed global economic model that maps financial supply chains and their associated physical resource intensities.
- Ecological Translation: The resource use is combined with LC-IMPACT (Life Cycle Impact Assessment), which translates land use and pollution into a standardized metric.
The Core Metrics: BDe and PDF
The output of these calculations is typically expressed in:
- BDe (Biodiversity Equivalents): A metric representing the share of all species on Earth at risk of disappearing due to a specific activity.
- PDF (Potentially Disappeared Fraction of species): A unit measuring the proportion of species likely to be lost in a specific area over a specific time due to environmental pressures.
3. What is the Purpose of Measuring?
Why should a business care about measuring its Nature Footprint when carbon tracking is already complex enough?
- Regulatory Compliance (ESRS E4): The European Sustainability Reporting Standards (ESRS) allocate an entire pillar to nature: ESRS E4 - Biodiversity and Ecosystems. Measuring your footprint ensures you can quantitatively satisfy these upcoming CSRD disclosure requirements.
- Supply Chain Transparency: Studies show that for many Nordic companies, over 90% of their biodiversity footprint is generated outside their home country, hidden deep within their global supply chains. Measurement illuminates these blind spots.
- Financial De-risking: Frameworks like the TNFD (Taskforce on Nature-related Financial Disclosures) are pushing investors to evaluate how heavily companies depend on functioning ecosystems. A high nature footprint is increasingly viewed as a financial liability.
4. How to Improve: From Footprint to Handprint
Improving your nature metrics requires a two-pronged strategy:
1. Shrink the Footprint (Mitigation)
- Supply Chain Audits: Shift procurement away from suppliers operating in high-biodiversity-risk regions (e.g., sourcing soy or beef from deforested areas).
- Circular Economy: Reduce virgin resource extraction by maximizing recycled inputs in your products.
2. Grow the Handprint (Positivity)
- Local Biodiversity Credits: Instead of buying cheap, opaque carbon offsets halfway across the world, invest in localized, verifiable nature restoration.
- Ecosystem Partnerships: Fund projects that clean up local environments, such as the John Nurminen Foundation's work to reduce eutrophication and restore the Baltic Sea.
The Software Advantage
Modern platforms (like ExecutESG) are beginning to offer dual-engine calculators where a single data upload simultaneously calculates both your GHG Carbon (tCO₂e) and your Nature Footprint (BDe), allowing you to offset both through integrated Nature-Positive Marketplaces.
5. The Ecosystem Map: Finland & The Nordics
Finland and the broader Nordic region have emerged as the global epicenter for biodiversity impact assessment, shifting the focus from mere mitigation to measurable positive impact. Here is the current ecosystem driving this innovation:
Academic Pioneers
- University of Jyväskylä (JYU.Wisdom): The architects behind the BIOVALENT database, leading the charge on corporate and consumer biodiversity footprinting.
- VTT Technical Research Centre & LUT University: The creators and champions of the "Handprint" methodology, establishing the scientific framework for measuring positive environmental impact.
Innovation & Funding
- Sitra (The Finnish Innovation Fund): A major catalyst supporting projects that create standardized, publicly available tools for assessing biodiversity impacts.
- Arene (Network of Finnish Universities of Applied Sciences): Currently leading a massive systemic shift in institutional sustainability by officially transitioning their goals from Carbon Neutrality to Nature Positivity.
Corporate Adopters & Tech Infrastructure
- S Group: Pioneering the application of biodiversity footprinting at the consumer retail level.
- ExecutESG: Building the digital infrastructure for SMEs. By wrapping the VSME standard, GHG tracking, and BIOVALENT nature footprinting into a single platform, ExecutESG is bridging the gap between high-level academic frameworks and practical, automated reporting for mid-market companies.
Conclusion
The era of carbon tunnel vision is ending. As we move closer to 2030, the companies that thrive will be those that understand their impact on the broader tapestry of life on Earth. By measuring the Nature Footprint and actively expanding the Nature Handprint, businesses can transition from being a burden on the planet to becoming a catalyst for its restoration.