Scope 1 vs. Scope 3 Emissions: The B2B Supplier Guide
Scope 1 vs. Scope 3 Emissions: The B2B Supplier Guide
If you are a B2B supplier, you have likely received an email recently from one of your largest corporate customers asking for your carbon footprint data. It usually sounds polite, but the subtext is clear: If you want to keep our business, we need your sustainability numbers.
To understand why this email landed in your inbox, you have to understand the core framework of carbon accounting—specifically, the difference between Scope 1 and Scope 3 emissions.
For large enterprises, calculating their carbon footprint is not just about their own office electricity or corporate fleet. They are legally mandated to report the emissions across their entire value chain. In this guide, we will explore the difference between Scope 1 and Scope 3 emissions, explain why your buyers are pushing these requirements down to you, and show how you can provide audit-ready data with minimal friction.
🔄 Large Enterprise Scope 3 = SME Scope 1 & 2
Why are large corporations asking for your data? Because carbon accounting is interconnected. Your operational footprint is a piece of their value chain footprint.
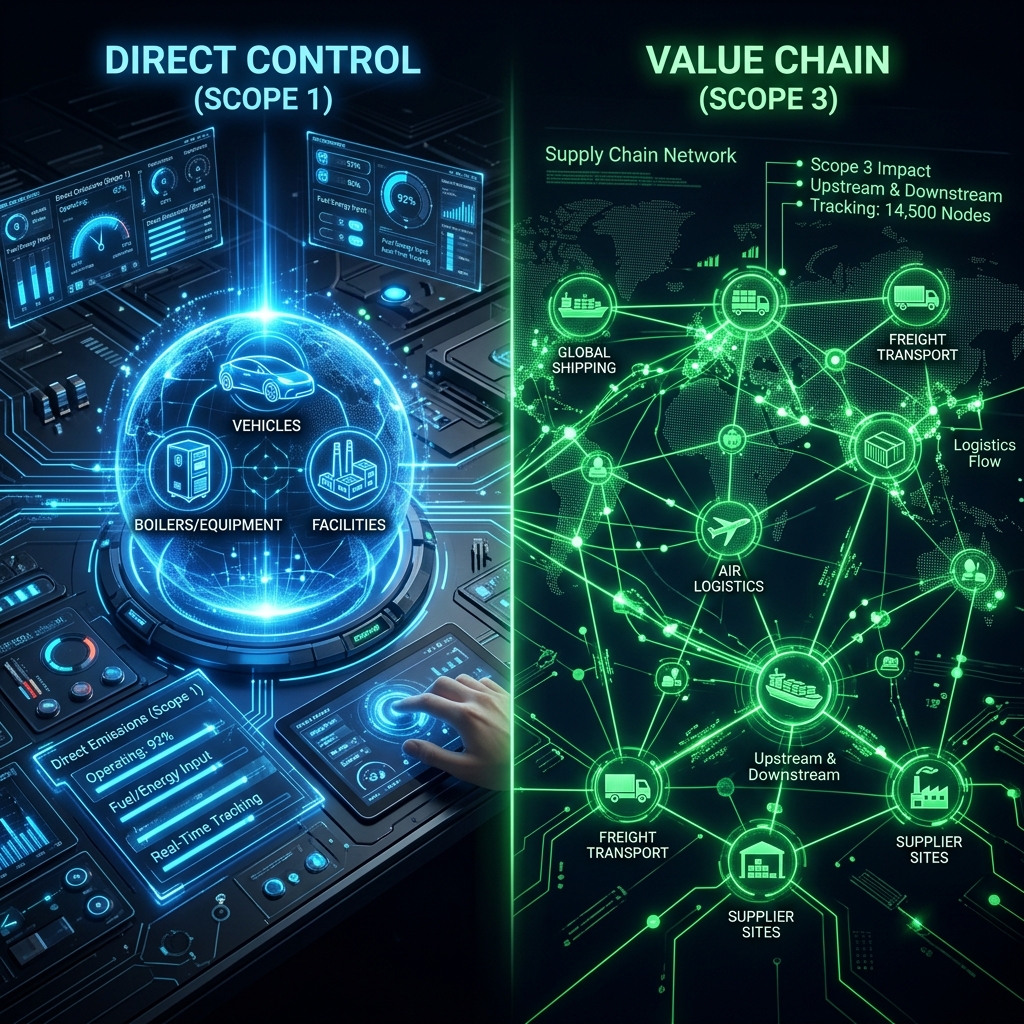
Your direct fuel combustion (Scope 1) and purchased office electricity (Scope 2).
Purchased Goods & Services. Your footprint forms part of their upstream supply chain emissions.
Scope 1 vs. Scope 3: The Key Differences at a Glance
Under the Greenhouse Gas (GHG) Protocol, all emissions are classified into three scopes based on where they physically occur. The difference between Scope 1 and Scope 3 represents the spectrum between direct ownership and value chain influence:
| Feature | Scope 1 (Direct Emissions) | Scope 3 (Value Chain Emissions) |
|---|---|---|
| Ownership | Assets owned or directly controlled by your company. | Assets owned by third parties (suppliers, logistics, customers). |
| Data Control | High. You have the utility bills, fuel logs, and maintenance invoices. | Low. You must rely on supplier estimates, travel agencies, and customer behaviors. |
| Share of Footprint | Typically small (under 10% for service/light manufacturing companies). | Massive (typically 80% to 95% of a business's total carbon impact). |
| Ease of Calculation | Straightforward. Basic fuel-to-CO₂ multiplication formulas. | Complex. Requires supplier surveys, spend-based estimates, and lifecycle analyses. |
| Examples | Company vehicles, gas boilers, on-site generator fuel, refrigerant leaks. | Purchased raw materials, business travel, third-party shipping, product end-of-life. |
Understanding Scope 1: What Your Business Directly Controls
Scope 1 emissions are direct greenhouse gas emissions from sources that are owned or controlled by your company. "Direct control" means you have the immediate operational authority to turn the emission source on or off.
Scope 1 includes four primary activities:
- Stationary Combustion: Burning gas, oil, or wood in boilers, furnaces, or heaters on your premises.
- Mobile Combustion: Burning petrol, diesel, or gas in cars, delivery vans, trucks, or mobile machinery owned or leased by your business.
- Process Emissions: Emissions released during industrial processes (such as manufacturing chemicals, smelting metals, or baking food on-site).
- Fugitive Emissions: Accidental gas leaks, most commonly refrigerant leakages from office air conditioning units or industrial cooling equipment.
How to Collect Scope 1 Data
For SMEs, calculating Scope 1 is highly manageable. You do not need an auditor; you simply need to pull:
- Gas utility bills (showing consumption in kWh or cubic meters).
- Fleet invoices or fuel card statements (showing liters of petrol or diesel consumed).
- Maintenance logs from HVAC contractors (showing the weight of refrigerants refilled in air conditioning systems).
Understanding Scope 3: Your Value Chain Footprint
Scope 3 emissions are indirect emissions that occur in your value chain, originating from sources you do not own or directly control. This covers the entire lifecycle of your business activities, divided into upstream (supplier-side) and downstream (customer-side) categories.
Scope 3 is separated into 15 specific categories under the GHG Protocol Corporate Value Chain (Scope 3) Standard:
- Upstream: Purchased goods & services (raw materials, software subscriptions), capital goods (machinery, building construction), fuel- and energy-related activities, upstream logistics/distribution, waste generated in operations (landfill vs. recycling), business travel, employee commuting, and leased assets you occupy.
- Downstream: Downstream logistics/distribution, processing of sold intermediate products, use of sold products, end-of-life treatment of sold products (waste recycling), downstream leased assets, franchises, and investments.
Why Scope 3 is the Biggest Challenge
Because you do not own the sources, collecting Scope 3 data requires collaborating with hundreds of external suppliers, estimating customer usage habits, and gathering employee travel records. For an average company, Scope 3 accounts for nearly 90% of their total carbon impact.
The B2B Supply Chain Trickle-Down: Why Your Buyers Care About Your Footprint
If Scope 3 is so difficult to measure, why are large enterprises attempting it? The answer is regulatory compliance and pressure from investors.
Under the European Union's Corporate Sustainability Reporting Directive (CSRD), over 50,000 large and listed companies are legally required to report their Scope 1, 2, and 3 emissions. The directive forces these large corporates to take responsibility for their entire value chain.
Here is how the trickle-down effect works:
- Enterprise CSRD Requirement: A large corporate buyer (e.g., a major manufacturer, telecom provider, or retail chain) must report their Scope 3 emissions.
- Scope 3 Category 1: The buyer's largest Scope 3 category is almost always Purchased Goods & Services—which represents everything they buy from their suppliers.
- The Supplier Request: To calculate their Category 1 emissions accurately, the buyer must add up the carbon footprints of their suppliers.
- The SME Impact: The buyer sends questionnaires or demands carbon reports from their supplier network (SMEs).
If you are an SME supplying to these large corporates, your Scope 1 and Scope 2 emissions form a part of their Scope 3 emissions. If you cannot provide this data, you represent a reporting "blind spot" for them, which may incentivize them to shift their purchasing to suppliers who can provide carbon data.
The Measuring Challenge: Primary Data vs. Spend-Based Estimates
When a corporate buyer calculates their Scope 3 emissions, they typically start with a spend-based method.
The Spend-Based Method (Low Accuracy)
The buyer multiplies the monetary value of what they purchase from you by a generic industry-average emission factor.
- Example: If they buy €100,000 worth of consulting services from you, they multiply €100,000 by a generic "business services" factor (e.g., 0.15 kg $CO_2e$/€) to estimate a footprint of 15 tonnes.
The problem with spend-based estimates is that they are highly inaccurate. If you invest in solar panels, insulate your office, or transition your fleet to electric vehicles, your customer's spend-based estimate will not show any reduction because it is based purely on the monetary value of the invoice.
Primary Data (High Accuracy)
To show real carbon reductions in their supply chain, corporate buyers want to transition from spend-based estimates to primary data (actual carbon footprint figures provided directly by you).
By providing your actual Scope 1 and Scope 2 figures, you enable your corporate customers to:
- Replace generic industry-average estimates with real, lower numbers.
- Reflect the actual decarbonization investments you have made.
- Report accurate Scope 3 reductions to their auditors and investors.
Your Buyers Are Waiting
Generate an Audit-Ready Carbon Report in 15 Minutes
Replace spend-based estimates with real Scope 1 & 2 data. Share a professional report your corporate customers will accept.
Start Your Free Carbon Report →Free forever plan · No credit card · 2 minute setup
How ExecutESG Solves the Scope 3 Data Gap
Many SMEs are overwhelmed by the prospect of carbon reporting, assuming it requires hiring expensive ESG consultants or spending weeks building complex spreadsheets.
ExecutESG was built to simplify this process:
- Focus on the VSME Standard: We align your data entry with EFRAG's Voluntary SME standard—the official European guideline designed to prevent SMEs from being overwhelmed by enterprise-level CSRD metrics.
- Built-in GHG Calculator: You do not need to look up emission factors. Simply type in your electricity consumption (kWh) and fuel usage (liters), and our calculator automatically applies country-specific grid factors.
- One-Click Shareable Reports: Generate a professional, audit-ready carbon report in PDF or machine-readable XBRL format. You can instantly share this with your corporate customers, banks, or investors to satisfy their sustainability requests.
Measuring your Scope 1 and 2 emissions is no longer just an environmental exercise—it is a critical mechanism for keeping your B2B customers and securing your supply chain position.
Ready to Share Your Carbon Data with Buyers?
Import your utility bills and fuel records. ExecutESG calculates your Scope 1 & 2 emissions and generates a professional report you can share with any corporate customer.
Create Your Free Account →